Module 02 · Data Science Topics
Lab: Exploring Data using IBM Cloud Gallery实验:使用 IBM Cloud Gallery 探索数据
Estimated Time (45 min)
估计时间(45 分钟)
IBM Cloud Resource hub is a growing collection of data sets, notebooks, and project templates. In this lab, you will use IBM Cloud Resource hub to explore different datasets. As you learned in the course, data can be more than just numbers. Data can be numeric, text, images, videos, audios and more. You will look at three samples.
IBM Cloud Resource hub 是一个不断增长的数据集、笔记本和项目模板的集合。在这个实验中,你将使用 IBM Cloud Resource hub 来探索不同的数据集。正如你在课程中学到的,数据不仅仅是数字。数据可以是数值、文本、图像、视频、音频等。你将查看三个样本。
Sample 1 contains data with only numeric attributes.
样本 1 包含只有数值属性的数据。
Sample 2 contains data with numeric & text attributes.
样本 2 包含具有数值和文本属性的数据。
Sample 3 cantains a Jupyter Notebook, a tool which data scientists use to create models.
样本 3 包含一个 Jupyter Notebook,这是一个数据科学家用来创建模型的工具。
Let's take a look at how data scientists use different datasets.
让我们看看数据科学家如何使用不同的数据集。
Objectives : 目标
You will learn to:
您将学习到:
- Explore the IBM Cloud Resource hub
探索 IBM 云资源中心 - Examine a numeric dataset
检查数值数据集 - Examine a dataset with non-numeric attributes
检查具有非数值属性的数据库 - Examine a Jupyter Notebook
检查 Jupyter Notebook
Exercise 1: Examine a numeric dataset 练习 1:检查一个数值数据集
- Click on the link: https://dataplatform.cloud.ibm.com/gallery
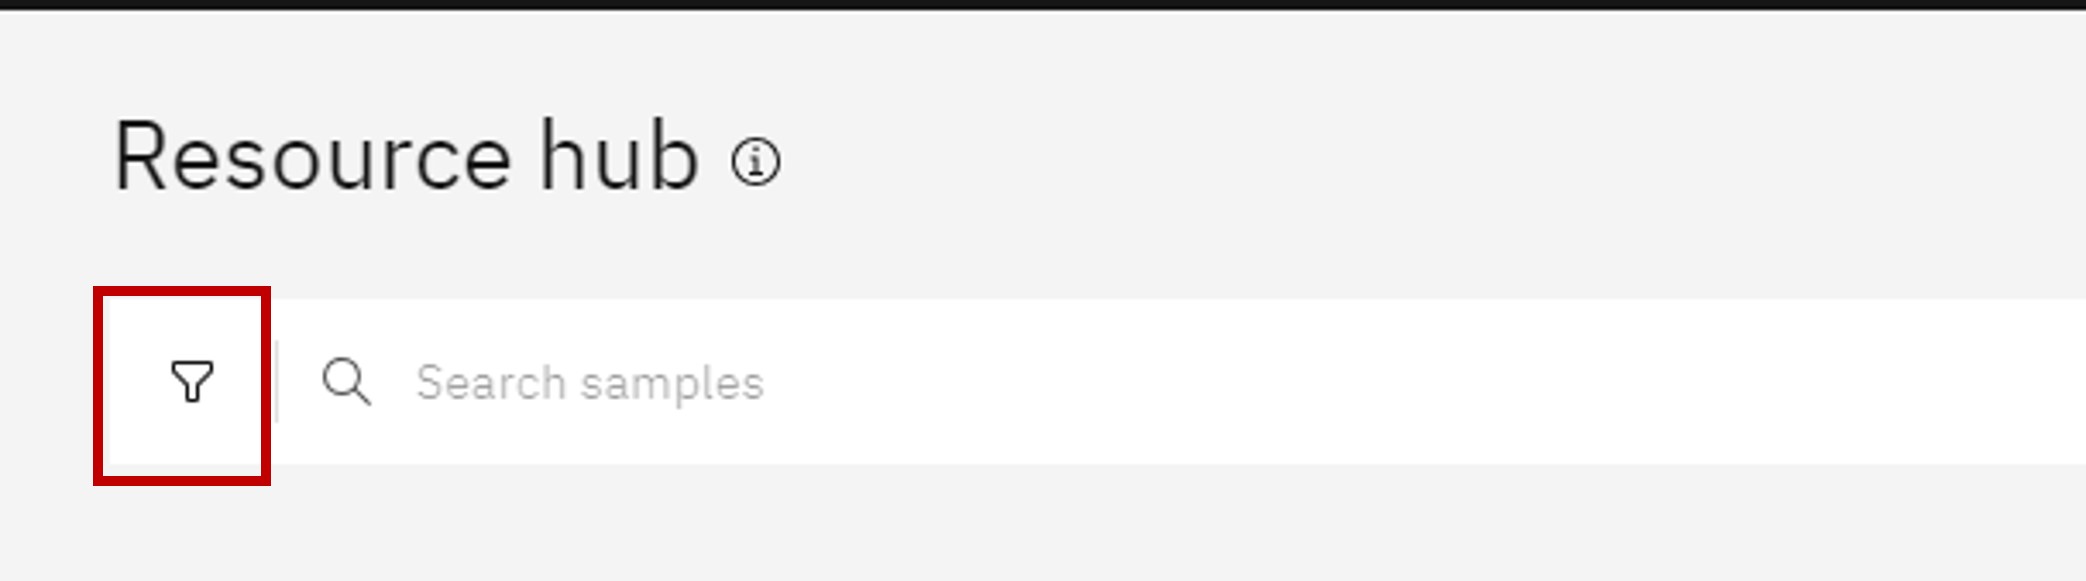
点击链接:https://dataplatform.cloud.ibm.com/gallery - Click the filter button in the top right of the window:
点击窗口右上角的过滤按钮:
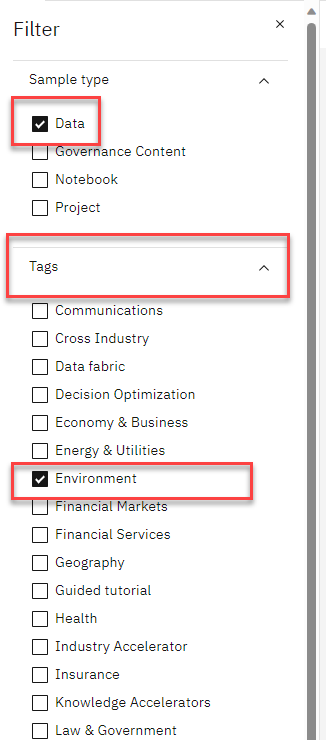
- In the dropdown menu that appears, select the Data checkbox under Sample type. Then click on the Tags dropdown, and select the Environment checkbox.
在出现的下拉菜单中,选择样本类型下的数据复选框。然后点击标签下拉菜单,选择环境复选框。
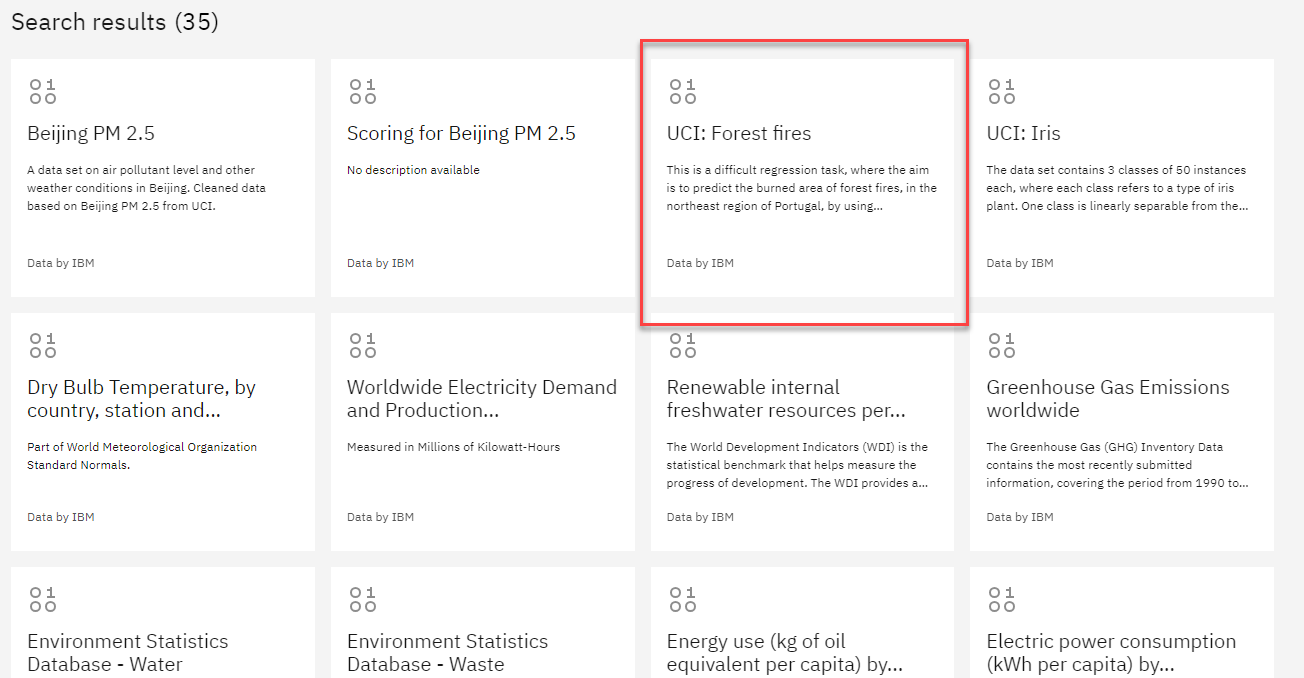
- In the search results, click on UCI: Forest Fires.
在搜索结果中,点击 UCI:森林火灾。
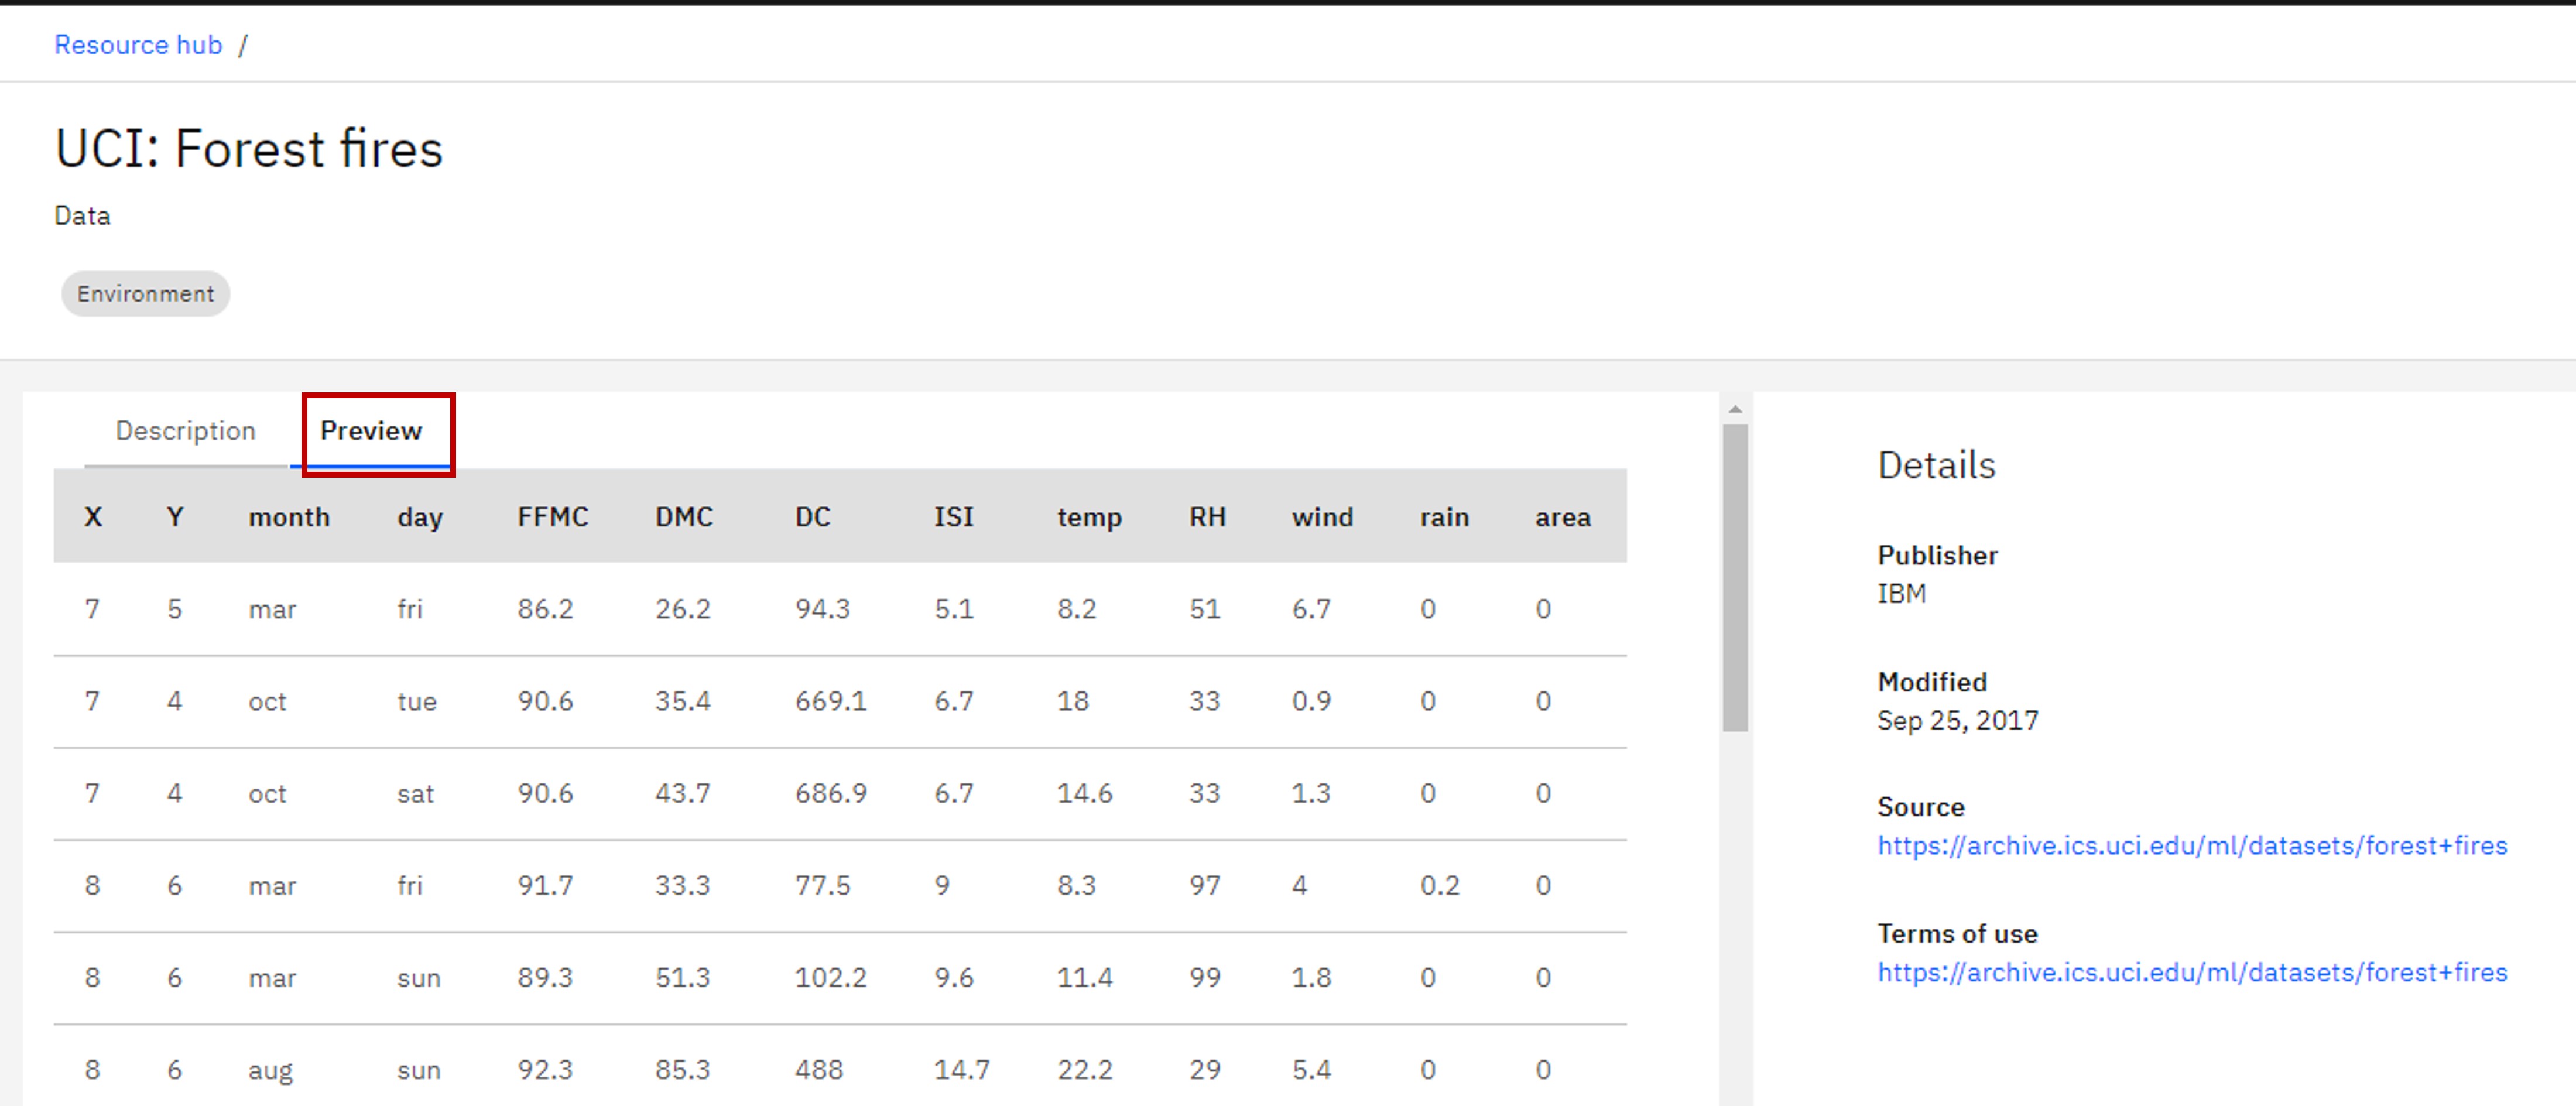
- Preview the data using the Preview option.
使用预览选项预览数据。
Explore the data 探索数据
The data is related to forest fires where the aim is to predict the burned area of forest fires, in the northeast region of Portugal, by using meterological and other data.
这些数据与森林火灾有关,目标是通过使用气象和其他数据来预测葡萄牙东北部森林火灾的烧毁面积。
Attribute Information: 属性信息:
- X - x-axis spatial coordinate within the Montesinho park map: 1 to 9
X - Montesinho 公园地图中的 x 轴空间坐标:1 到 9 - Y - y-axis spatial coordinate within the Montesinho park map: 2 to 9
Y - Montesinho 公园地图中的 y 轴空间坐标:2 到 9 - month - month of the year: 'jan' to 'dec'
month - 年份中的月份:'jan'到'dec' - day - day of the week: 'mon' to 'sun'
day - 一周中的日期:'mon'到'sun' - FFMC - FFMC index from the FWI system: 18.7 to 96.20
FFMC - FFMC 指数(FWI 系统):18.7 至 96.20 - DMC - DMC index from the FWI system: 1.1 to 291.3
DMC - DMC 指数(FWI 系统):1.1 至 291.3 - DC - DC index from the FWI system: 7.9 to 860.6
DC - DC 指数(FWI 系统):7.9 至 860.6 - ISI - ISI index from the FWI system: 0.0 to 56.10
ISI - ISI 指数(FWI 系统):0.0 至 56.10 - temp - temperature in Celsius degrees: 2.2 to 33.30
temp - 摄氏度温度:2.2 至 33.30 - RH - relative humidity in %: 15.0 to 100
RH - 相对湿度(%):15.0 至 100 - wind - wind speed in km/h: 0.40 to 9.40
wind - 风速(km/h):0.40 至 9.40 - rain - outside rain in mm/m2 : 0.0 to 6.4
雨 - 外部降雨量(单位:mm/m²):0.0 至 6.4 - area - the burned area of the forest (in ha): 0.00 to 1090.84
area - 森林烧毁面积(公顷):0.00 至 1090.84
(this output variable is very skewed towards 0.0, thus it may make sense to model with the logarithm transform).
(该输出变量严重偏向 0.0,因此可能需要使用对数变换进行建模是有意义的)。
Exercise 2: Evaluate a non-numeric dataset 练习 2:评估一个非数值数据集
The data doesn't have to be only based on numbers. Data can be text, images and other types as well. Let's look at a dataset which has text values.
数据不必仅基于数字。数据可以是文本、图像以及其他类型。让我们来看一个包含文本值的数据集。
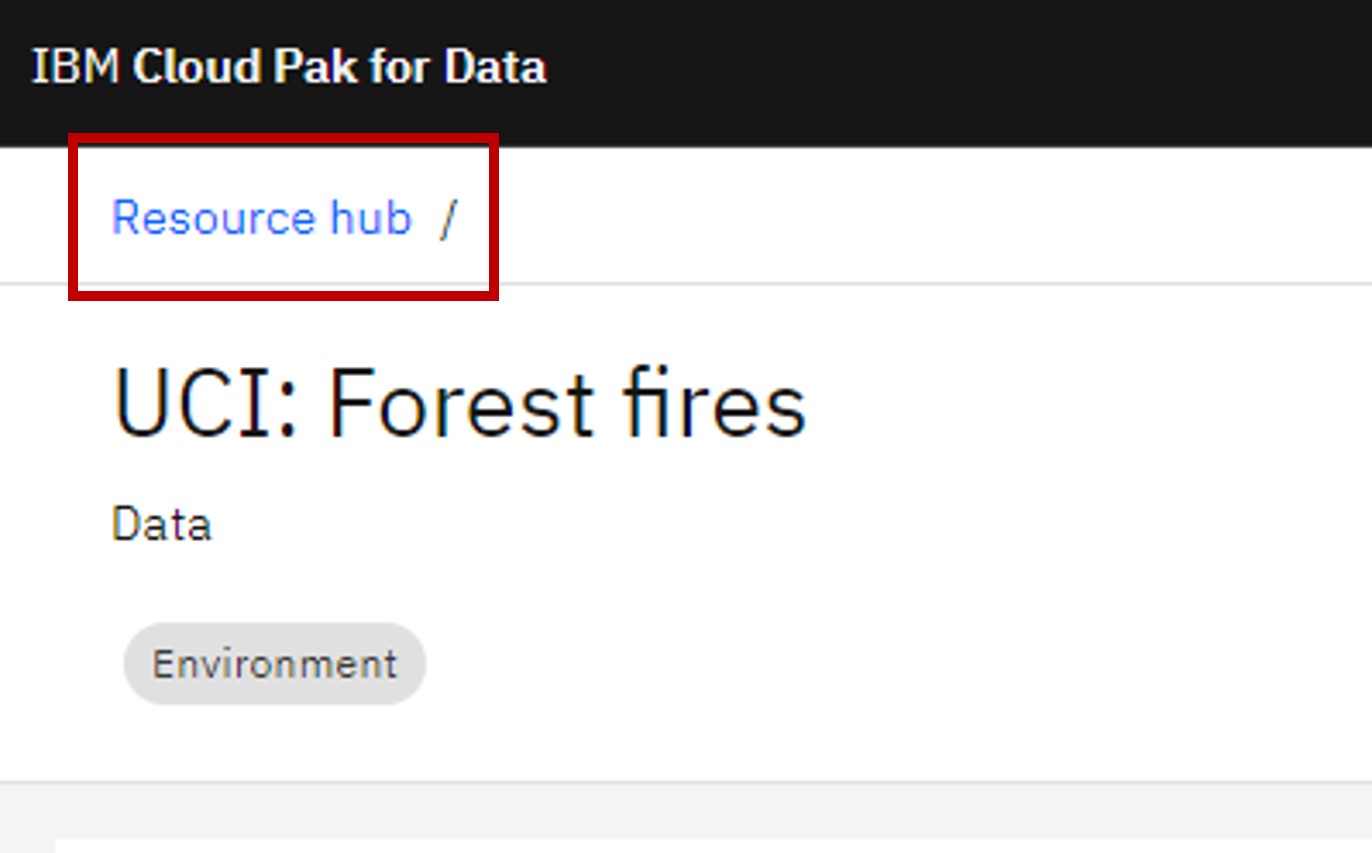
- At the top of the page, select the Resource hub option.
在页面顶部,选择资源中心选项。
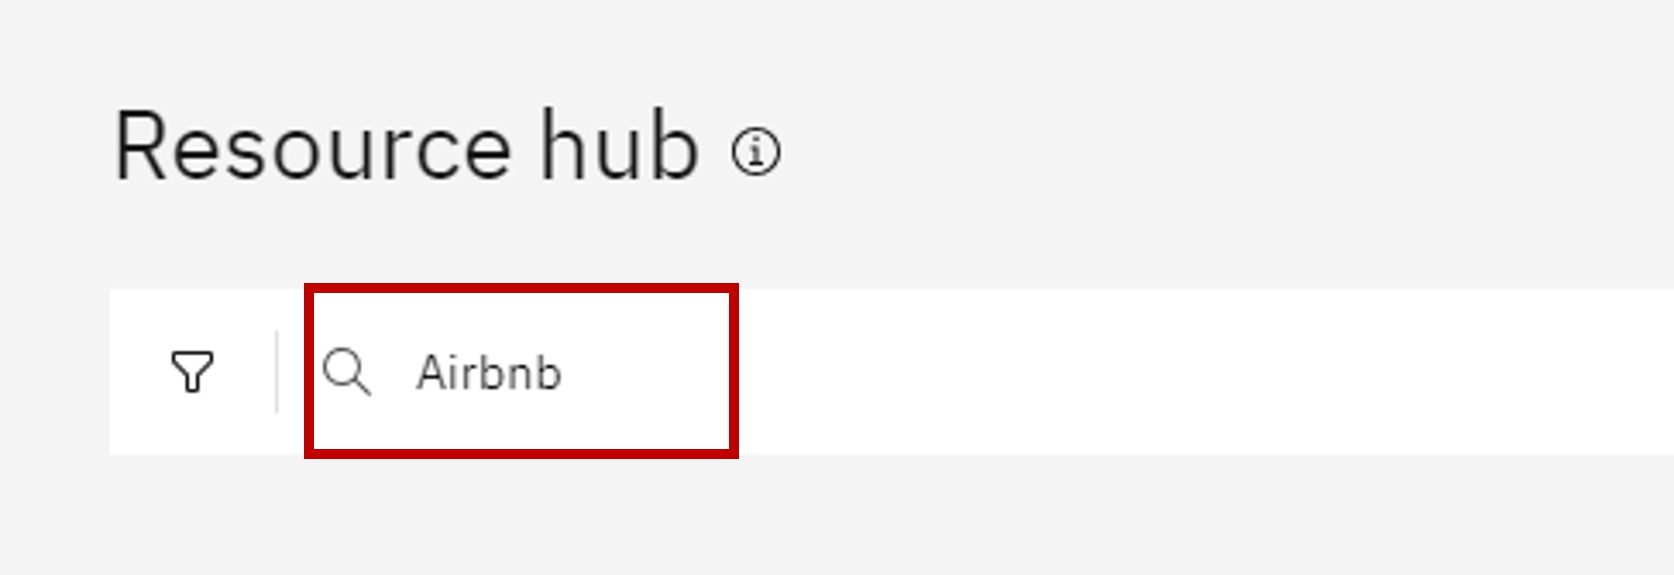
- Type Airbnb into the search bar.
在搜索栏中输入 Airbnb。
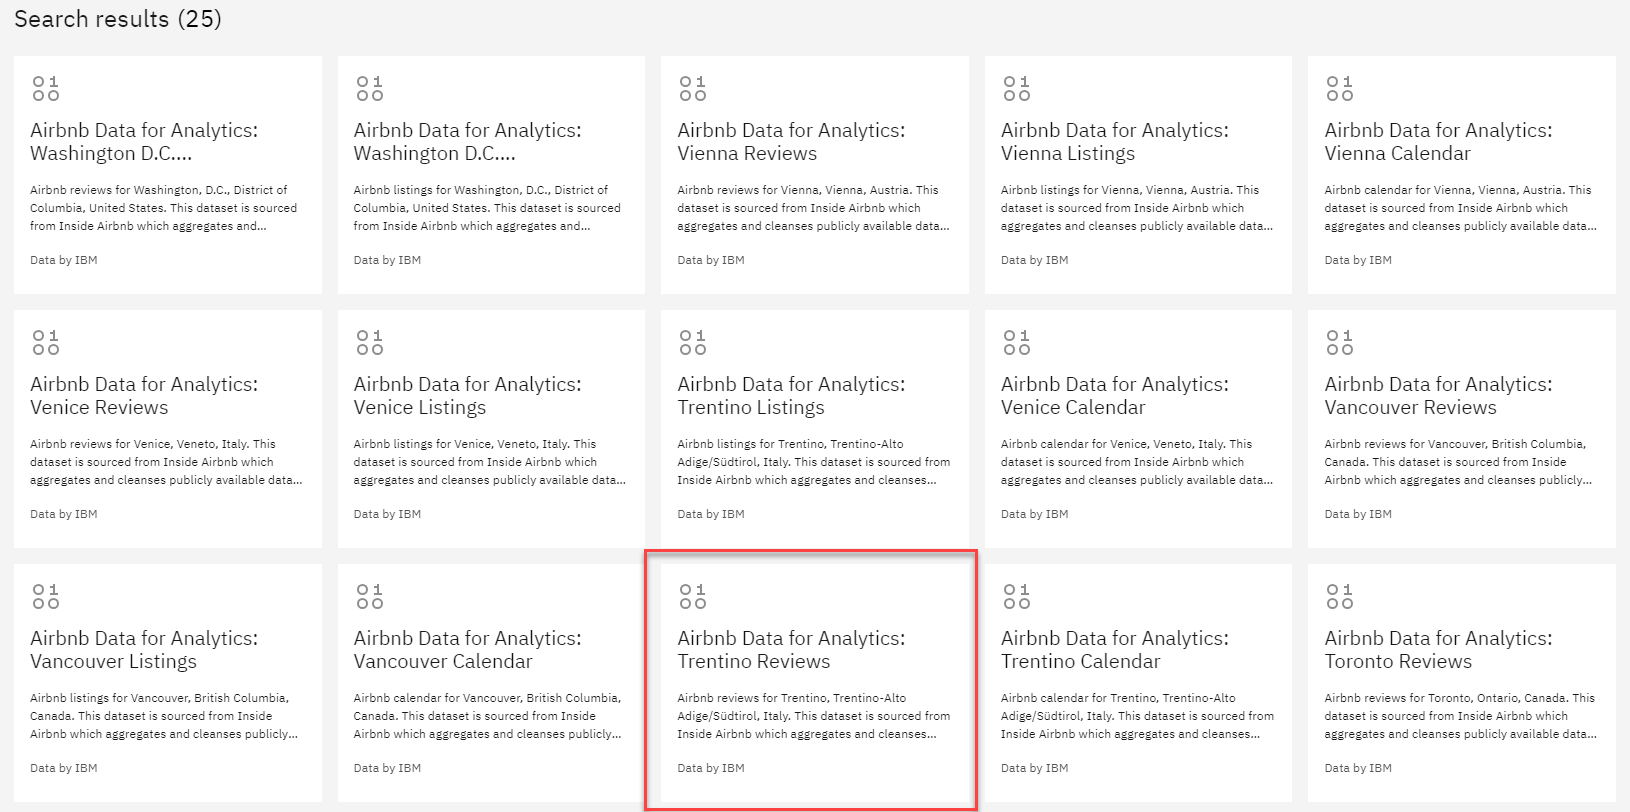
- Select the Airbnb Data for Analytics: Trentino Reviews option. You may need to scroll to find it.
选择“Airbnb 数据用于分析:Trentino 评论”选项。您可能需要滚动查找。
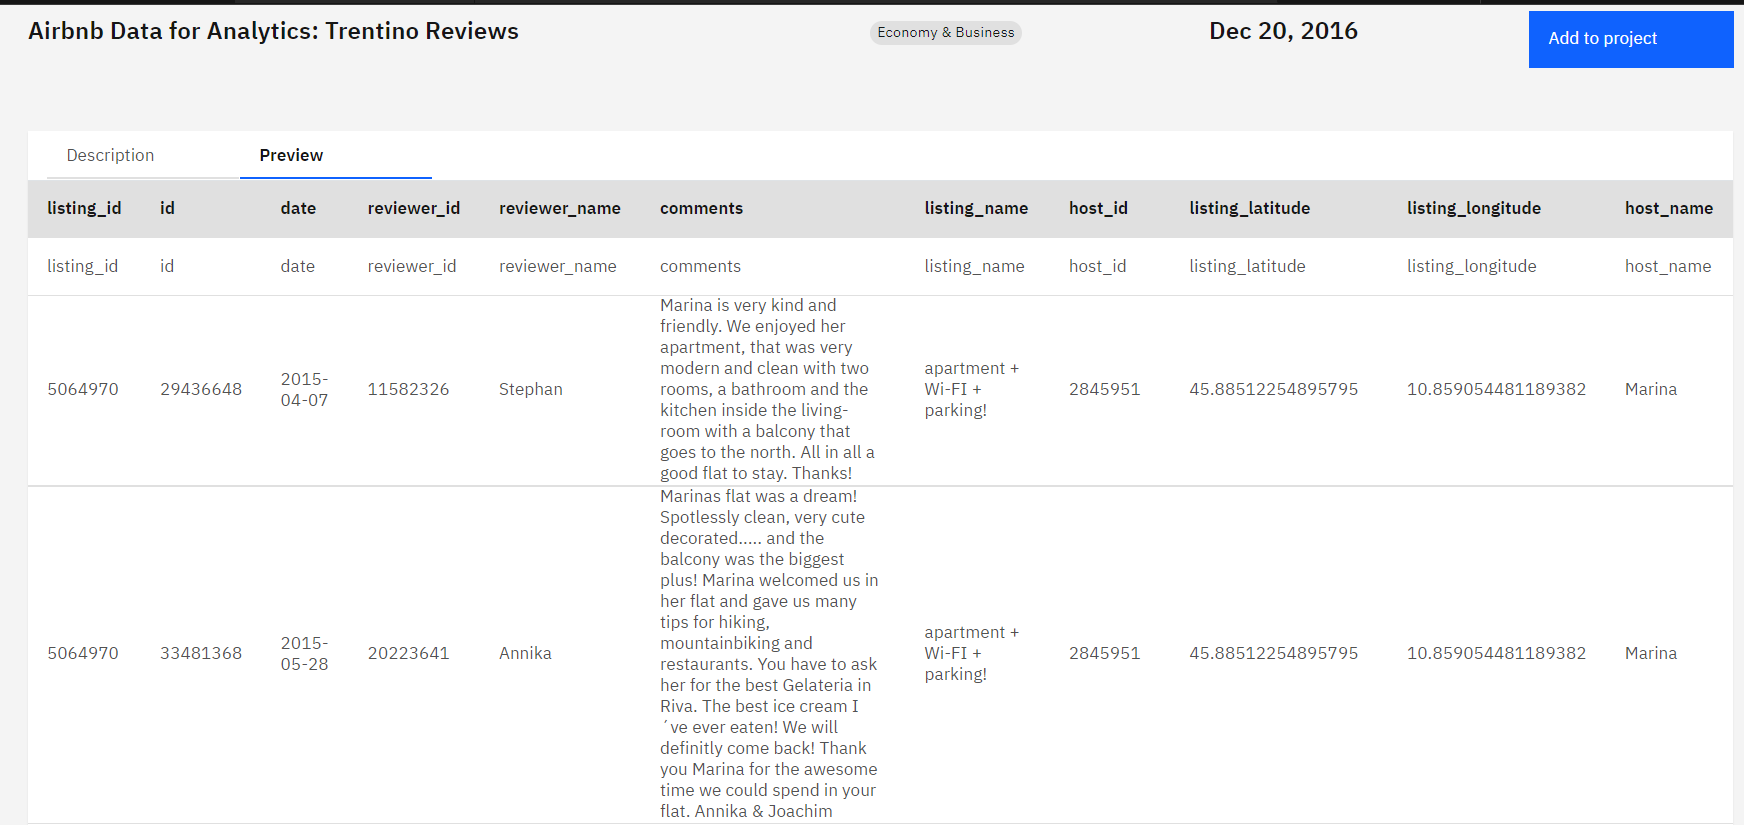
- Preview the data using the Preview option.
使用预览选项预览数据。
Explore the data 探索数据
Airbnb, Inc. is an American company that operates an online marketplace for lodging, primarily homestays for vacation rentals, and tourism activities. Airbnb guests may leave a review after their stay, and these can be used as an indicator of airbnb activity. The minimum stay, price and number of reviews have been used to estimate the occupancy rate, the number of nights per year and the income per month for each listing.
Airbnb, Inc.是一家美国公司,运营一个住宿在线市场,主要为度假租赁提供住宿,以及旅游活动。Airbnb 的客人可以在入住后留下评论,这些评论可以用作衡量 Airbnb 活动水平的指标。已使用最短入住时间、价格和评论数量来估计每个房源的入住率、每年入住天数和每月收入。
You could use this data in multitude of ways - to analyze the star ratings of places, to analyze the location preferences of the customers, to analyze the tone and sentiment of customer reviews and many more. Airbnb uses location data to improve guest satisfaction.
您可以用这种方式使用这些数据——分析地点的星级评分、分析顾客的地理位置偏好、分析顾客评论的语气和情感等等。Airbnb 使用地理位置数据来提高顾客满意度。
💡 What else might you use this data for?
💡 您还可能用这些数据做什么?
The dataset comprises of three main tables:
该数据集由三个主要表格组成:
- listings - Detailed listings data showing 96 attributes for each of the listings. Some of the attributes used in the analysis are price(continuous), longitude (continuous), latitude (continuous), listing_type (categorical), is_superhost (categorical), neighbourhood (categorical), ratings (continuous) among others.
listings - 详细列表数据,显示每个列表的 96 个属性。分析中使用的属性包括价格(连续型)、经度(连续型)、纬度(连续型)、列表类型(分类型)、是否为超级房东(分类型)、社区(分类型)、评分(连续型)等等。 - reviews - Detailed reviews given by the guests with 6 attributes. Key attributes include date (datetime), listing_id (discrete), reviewer_id (discrete) and comment (textual).
评论 - 客人提供的详细评论,包含 6 个属性。关键属性包括日期(日期时间)、列表 ID(离散)、评论者 ID(离散)和评论内容(文本)。 - calendar - Provides details about booking for the next year by listing. Four attributes in total including listing_id (discrete), date(datetime), available (categorical) and price (continuous).
日历 - 提供关于未来一年预订的详细信息。总共包括四个属性:列表 ID(离散)、日期(日期时间)、可用性(分类)和价格(连续)。
Exercise 3: Evaluate Jupyter Notebook 练习 3:评估 Jupyter Notebook
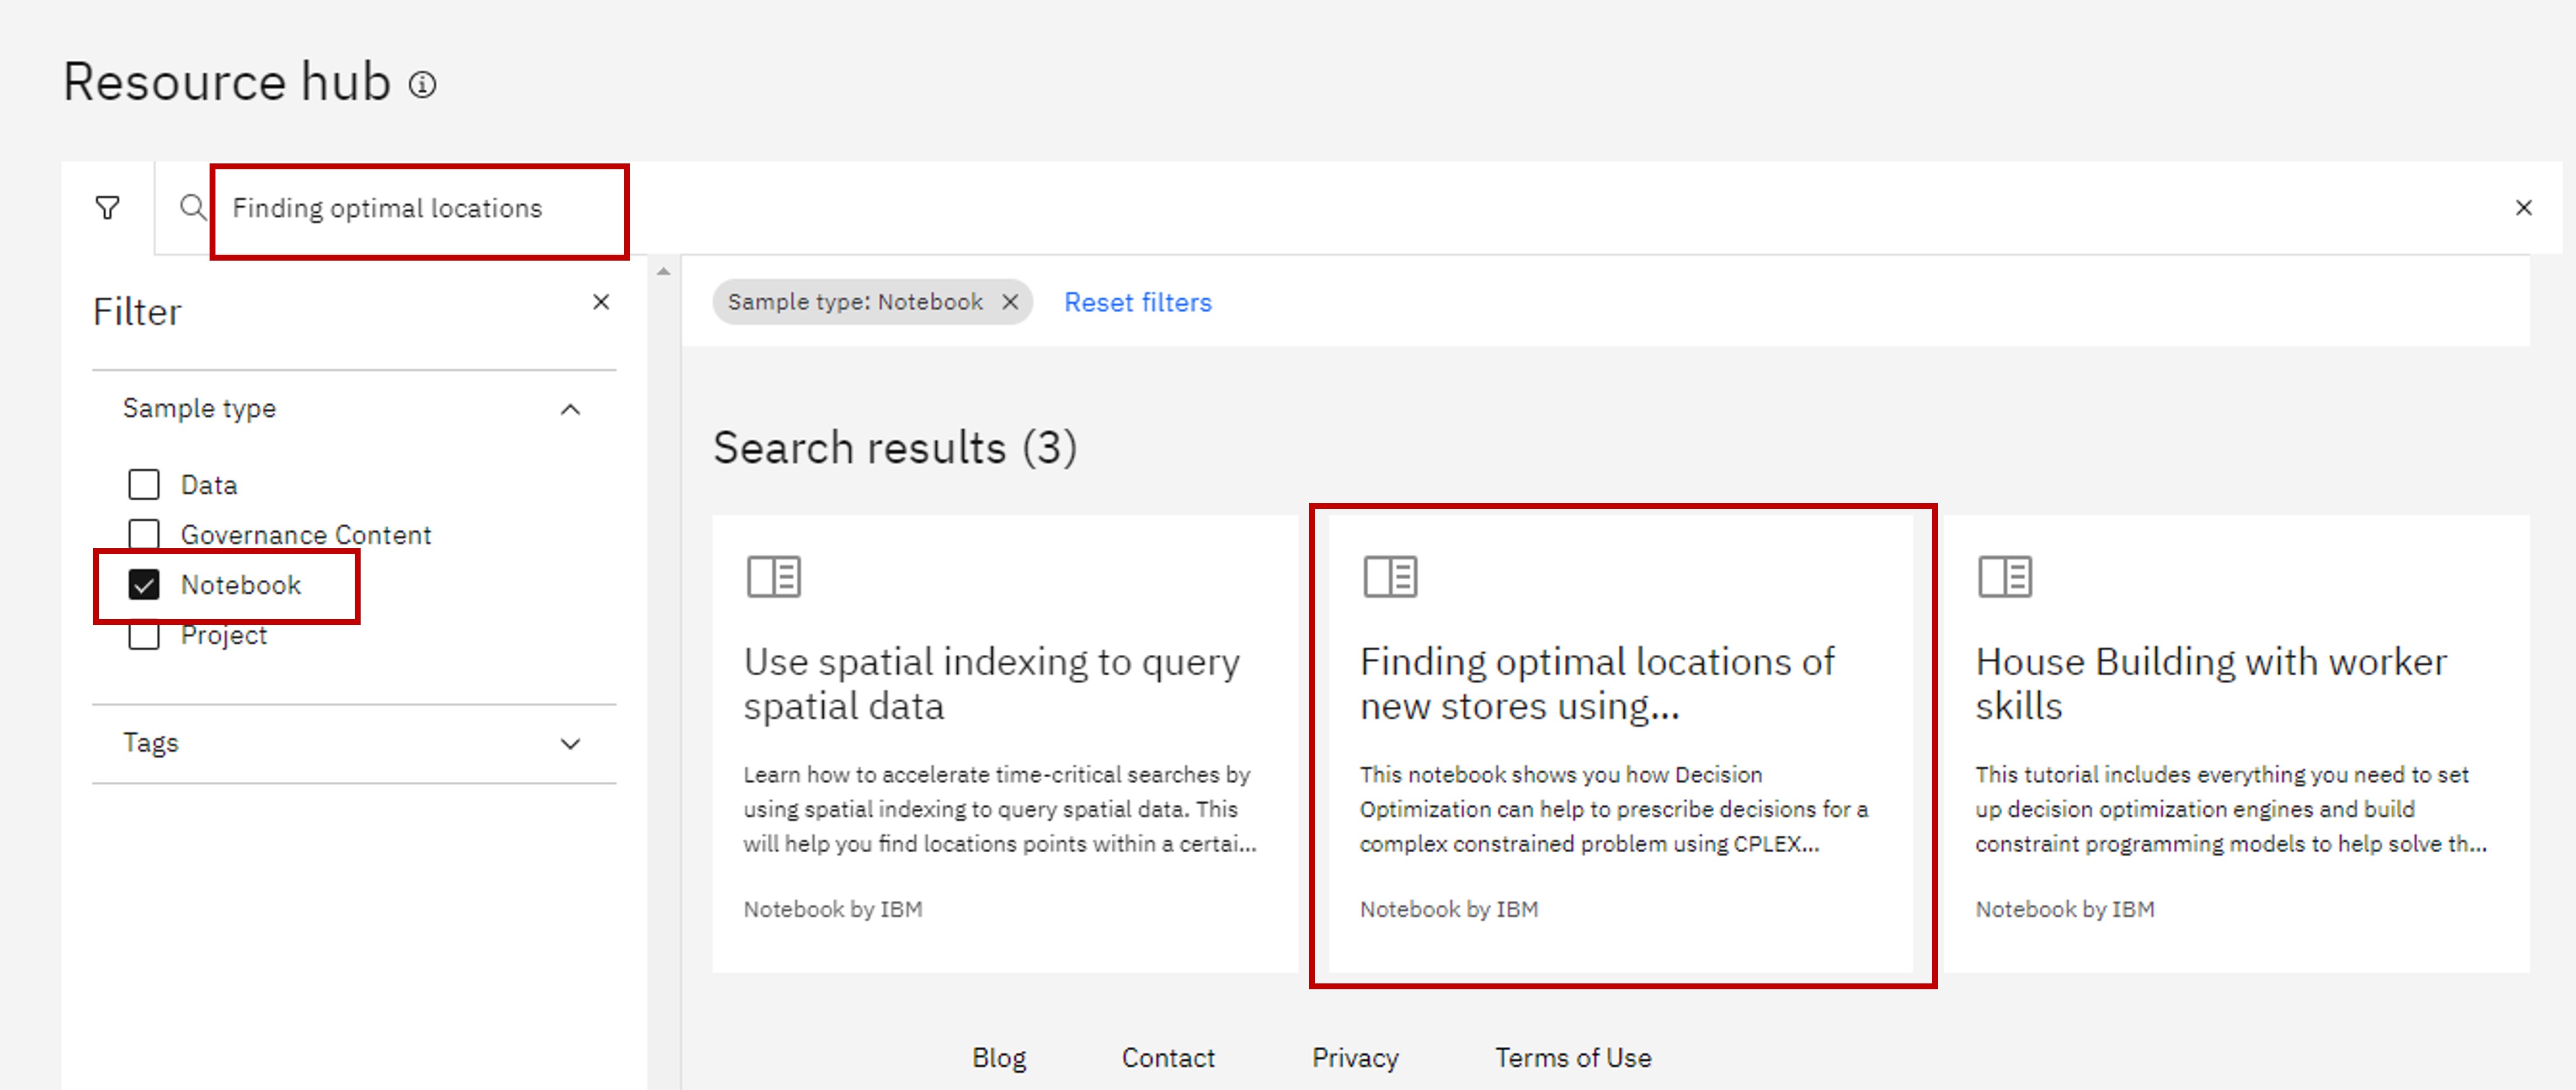
Return to the Resource hub. Select Notebook from the Sample type menu that appears after clicking on the filter button. In the search bar type Finding optimal locations Select the card that says Finding optimal locations of new stores using…
返回资源中心。点击筛选按钮后,在出现的样本类型菜单中选择 Notebook。在搜索栏中输入 Finding optimal locations,选择标有 Finding optimal locations of new stores using…的卡片。
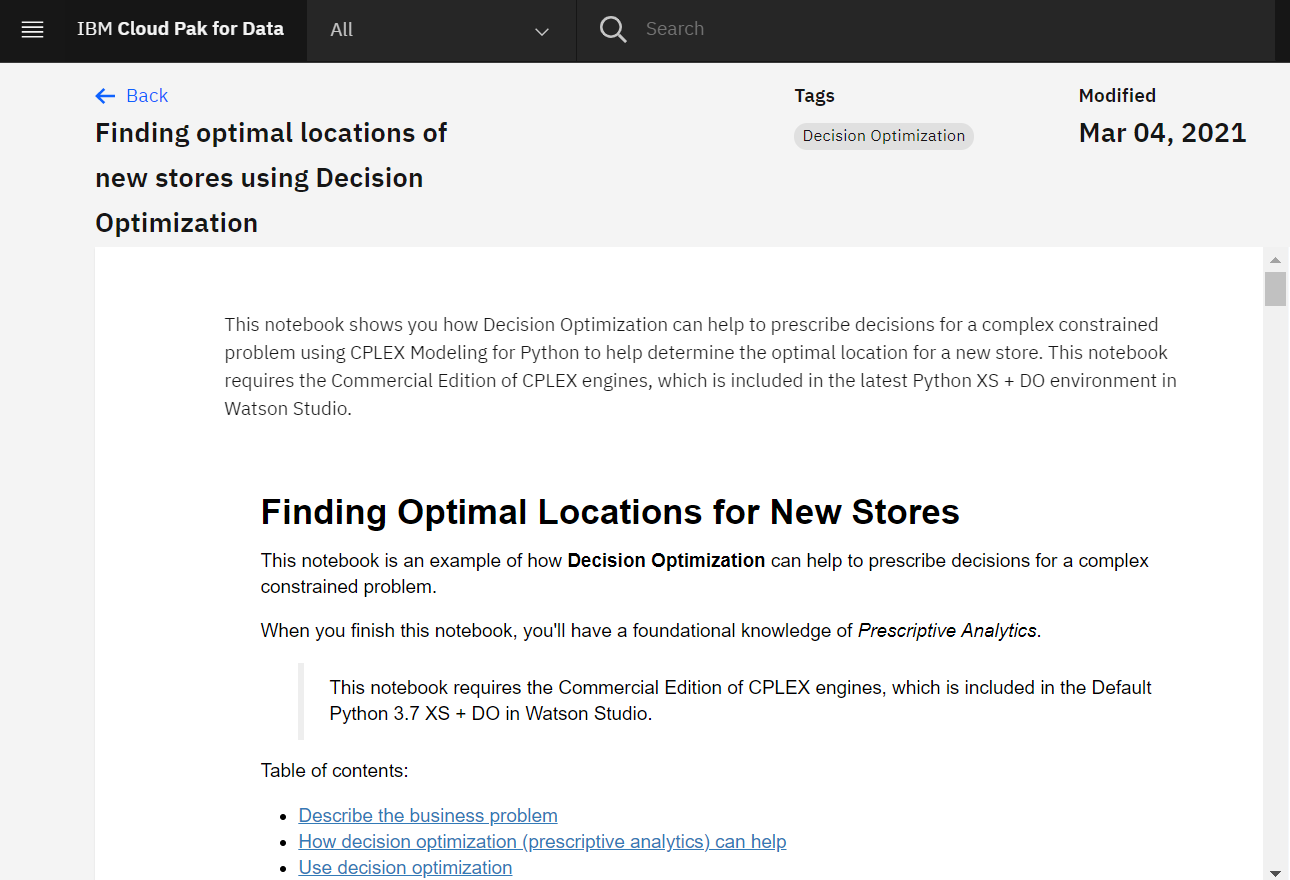
This Jupyter notebook uses Decision Optimization with Python to help determine the optimal location of a new store.
这个 Jupyter 笔记本使用 Python 中的决策优化来帮助确定新店的最佳位置。
This Notebook aims to identify where to place a coffee shop that minimizes the total distance from libraries in the area to the shop so that a book reader can get to the shop easily.
本笔记本旨在确定咖啡店的最佳位置,以使该区域内的图书馆到店的总距离最小,以便读者能够轻松到达商店。
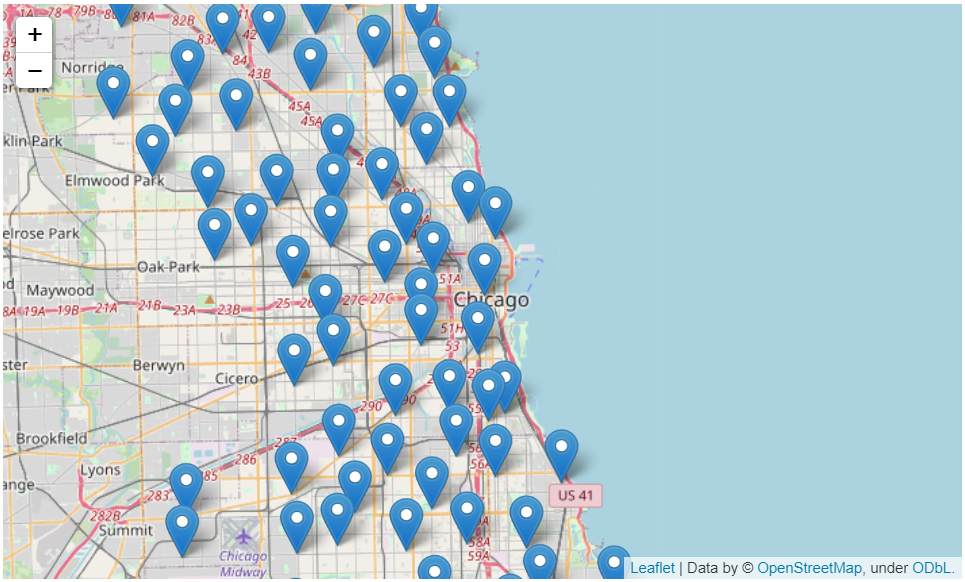
Part of the Python code in the notebook displays the locations of the libraries on a map.
笔记本中的部分 Python 代码在地图上显示了图书馆的位置。
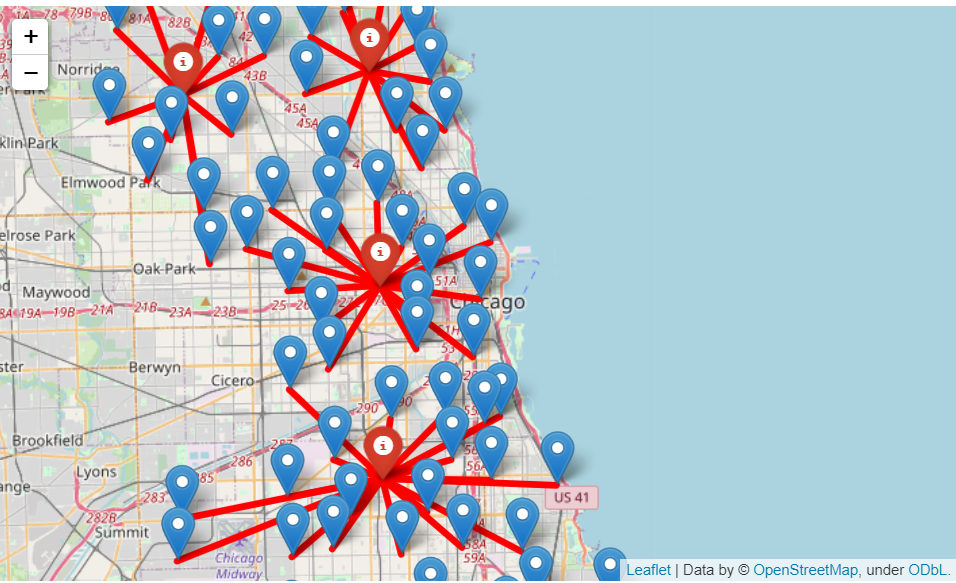
But with this data, you cannot determine the ideal location of the coffee shops by just looking at the map.
但是,仅通过查看地图,你无法根据这些数据确定咖啡店的理想位置。
The code then solves this with an optimization model that will help determine possible locations for the coffee shops with the stipulation of minimizing the distance between the libraries and the shop.
代码随后通过一个优化模型来解决此问题,该模型将有助于确定咖啡馆的可能位置,并规定要最小化图书馆与商店之间的距离。
Summary 摘要
In this lab, you have learnt about to explore datasets and notebooks in IBM cloud Resource hub.
在本实验中,你学习了如何探索 IBM 云资源中心中的数据集和笔记本。