Module 05 · RStudio & GitHub
Creating Data Visualizations using ggplot使用 ggplot 创建数据可视化
In this lab, you will learn how to create some basic visualizations in R.
Objective for Exercise 练习目标
We will create different data visualizations using the ggplot package using the inbuilt dataset in R called mtcars
我们将使用 ggplot 包,基于 R 中的内置数据集 mtcars 创建不同的数据可视化。
- Click on the
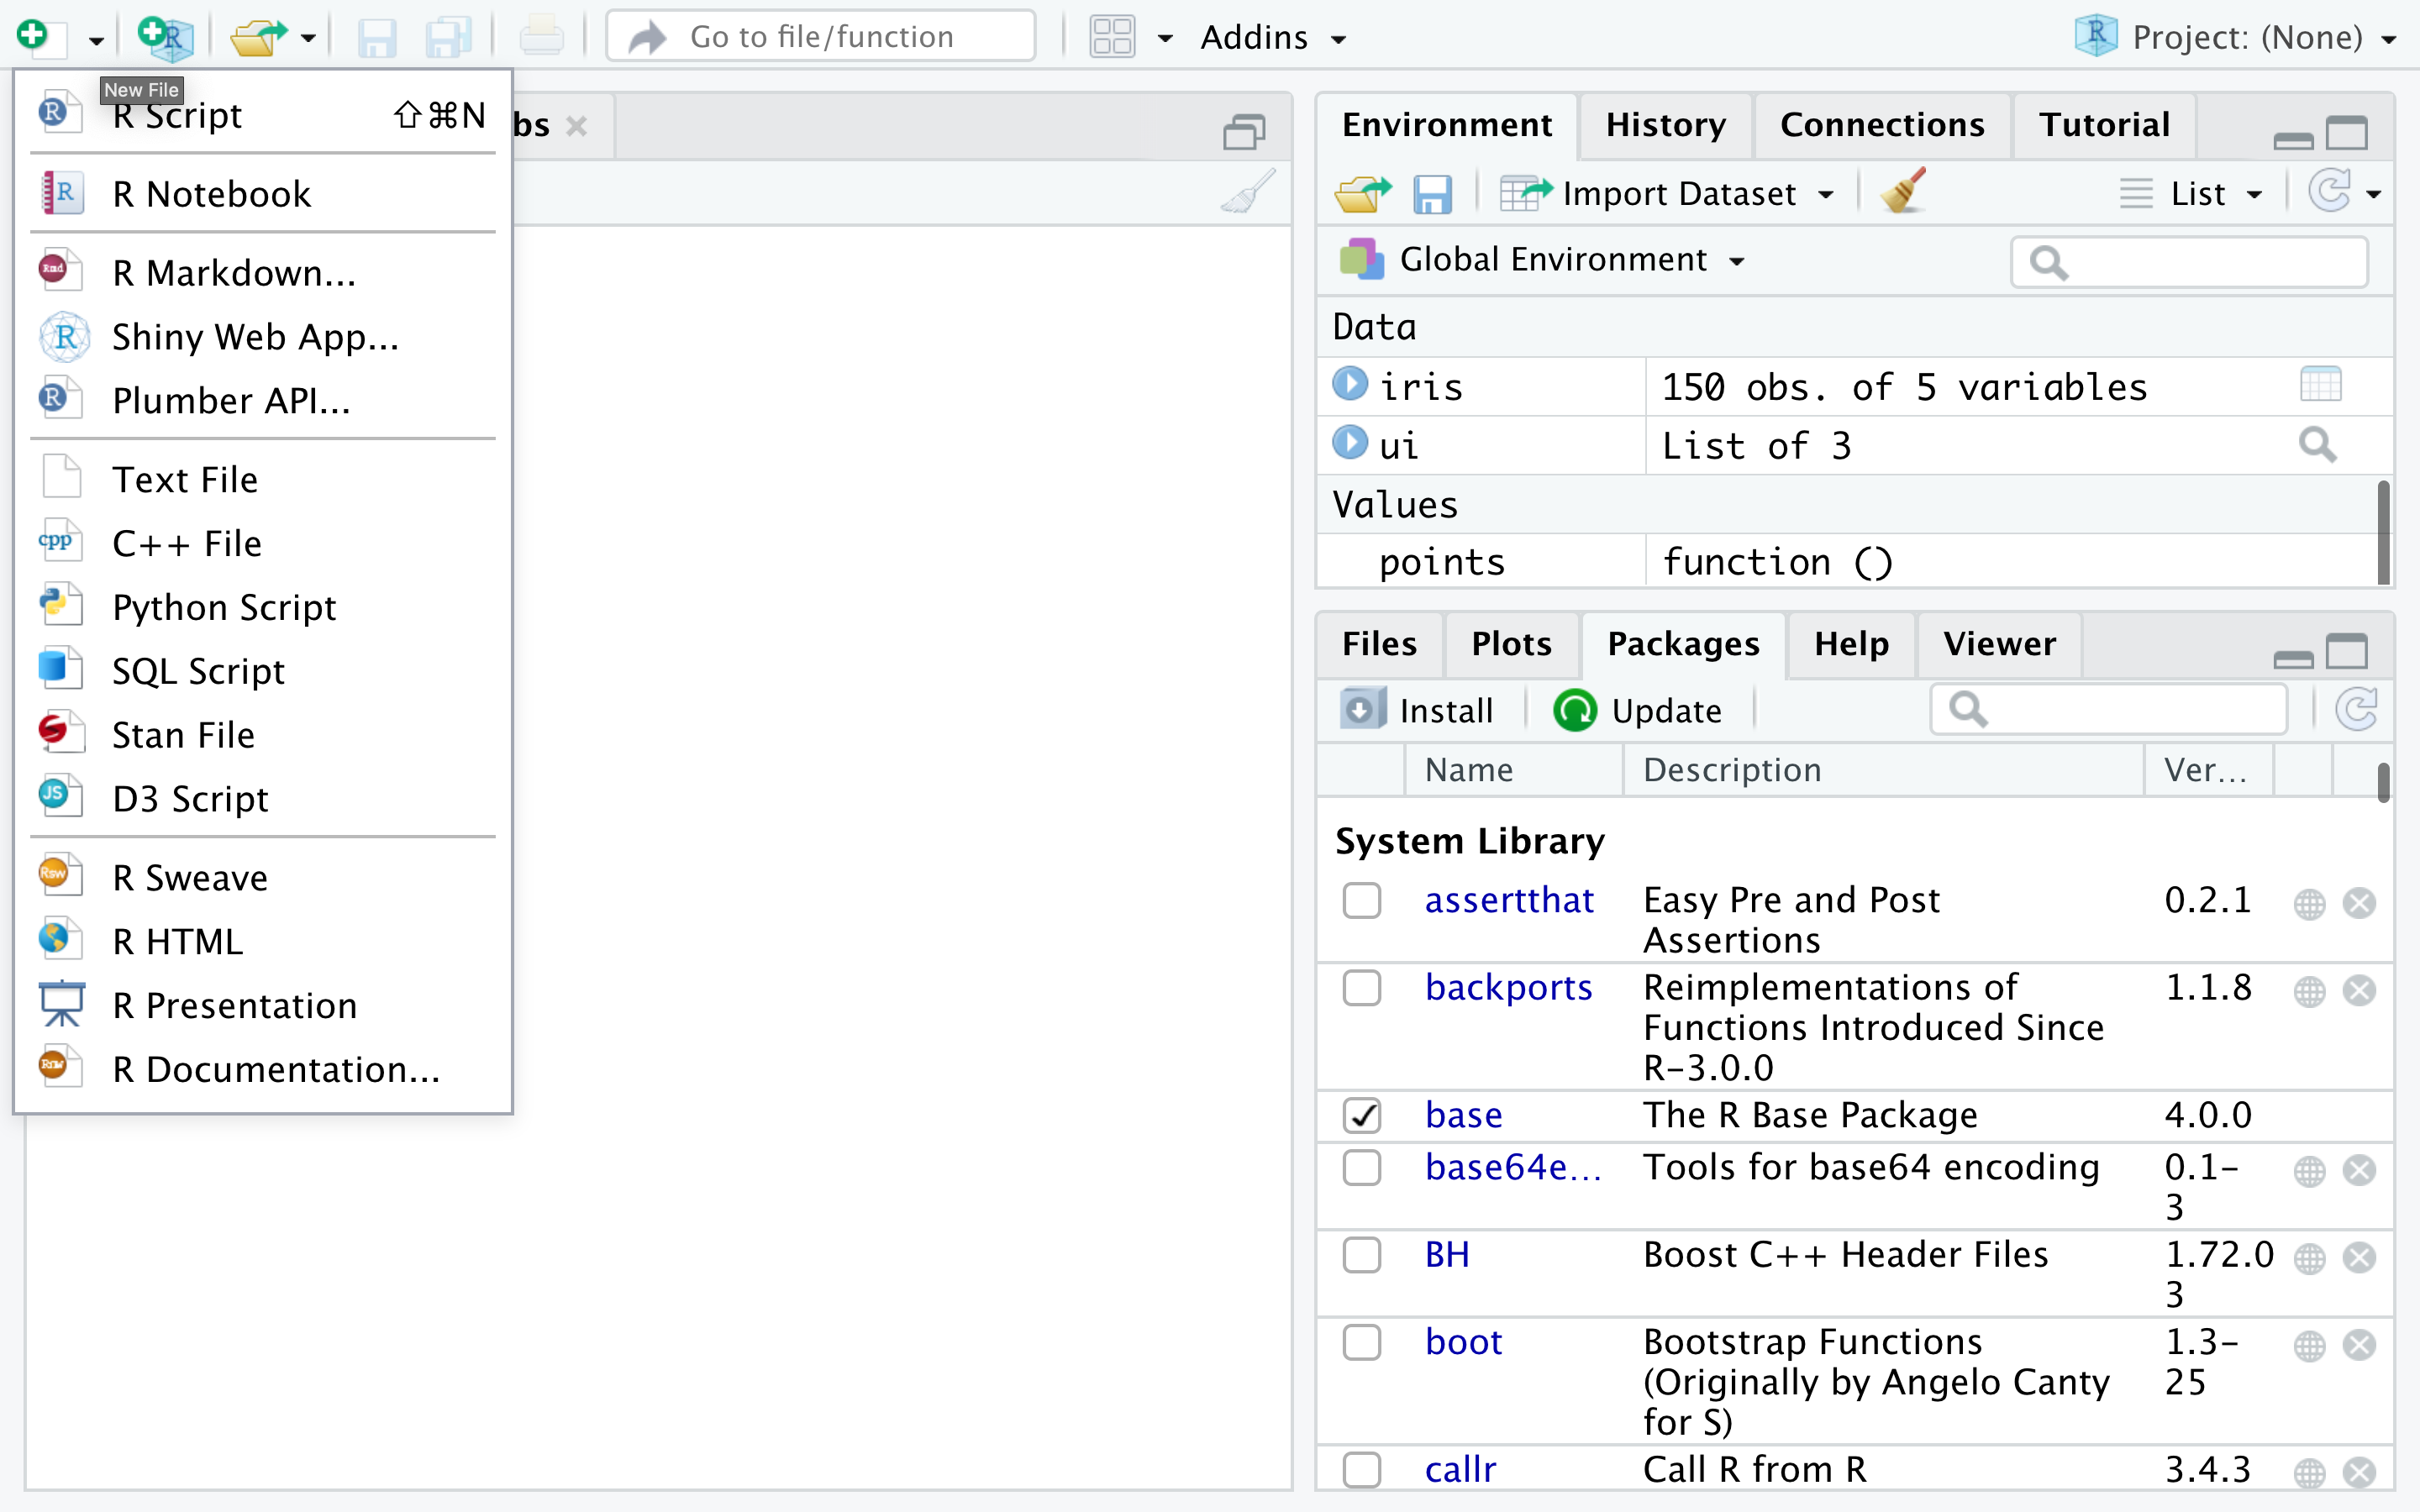
+symbol on the top left and chooseR Scriptfrom the menu to open a new R edit window in RStudio:
点击 RStudio 左上角的+符号,从菜单中选择R Script,以在 RStudio 中打开一个新的 R 编辑窗口:
-
Read and view the first 5 rows of the Data using the following:
使用以下方法读取并查看数据的前 5 行:library(datasets) #Load Data data(mtcars) #View first 5 rows head(mtcars, 5) -
Type this
?mtcarsto get information about the variables. This will print the information at the bottom right panel, on theHelptab
输入这个?mtcars获取关于变量的信息。这将把信息打印在右下角的面板中,在Help标签页 -
Copy and paste the following code to load the
ggplotpackage and create a scatterplot ofdispandmpg.
复制并粘贴以下代码以加载ggplot包并创建disp和mpg的散点图。#load ggplot package library(ggplot2) #create a scatterplot of displacement (disp) and miles per gallon (mpg) ggplot(aes(x=disp,y=mpg,),data=mtcars)+geom_point() -
Use the following code to add a title.
使用以下代码添加标题。#Add a title ggplot(aes(x=disp,y=mpg,),data=mtcars)+geom_point()+ggtitle("displacement vs miles per gallon") -
Use the following code to change the name of the
x-axisandy-axis
使用以下代码更改x-axis和y-axis的名称。#change axis name ggplot(aes(x=disp,y=mpg,),data=mtcars)+geom_point()+ggtitle("displacement vs miles per gallon") + labs(x = "Displacement", y = "Miles per Gallon") -
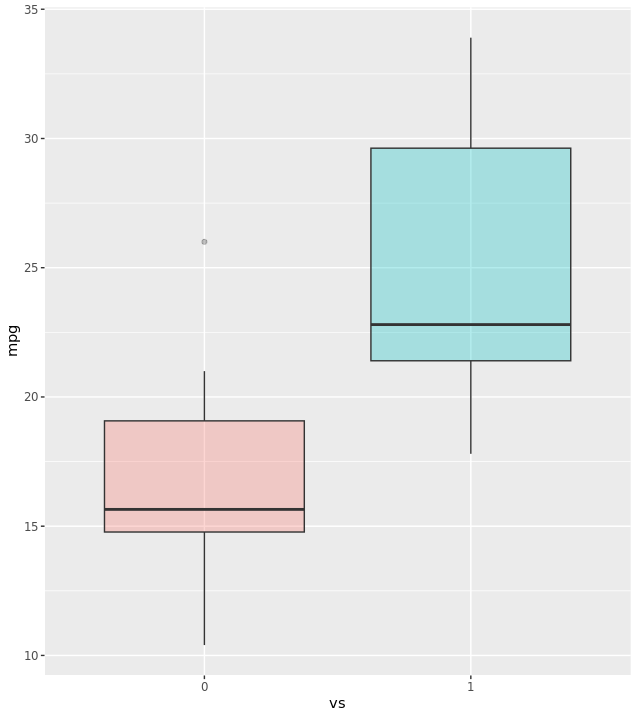
Use the following to create a boxplot of the the distribution of
mpgfor the individual Engine typesvs Engine (0 = V-shaped, 1 = straight)
使用以下方法为不同的发动机类型vs Engine (0 = V-shaped, 1 = straight)创建mpg分布的箱线图:
To do this you have to makevsa string or factor.
为此,您必须将vs转换为字符串或因子。#make vs a factor mtcars$vs <- as.factor(mtcars$vs) #create boxplot of the distribution for v-shaped and straight Engine ggplot(aes(x=vs, y=mpg), data = mtcars) + geom_boxplot() -
Add color to the boxplots to help differentiate:
为箱线图添加颜色以帮助区分:ggplot(aes(x=vs, y=mpg, fill = vs), data = mtcars) + geom_boxplot(alpha=0.3) + theme(legend.position="none")
-
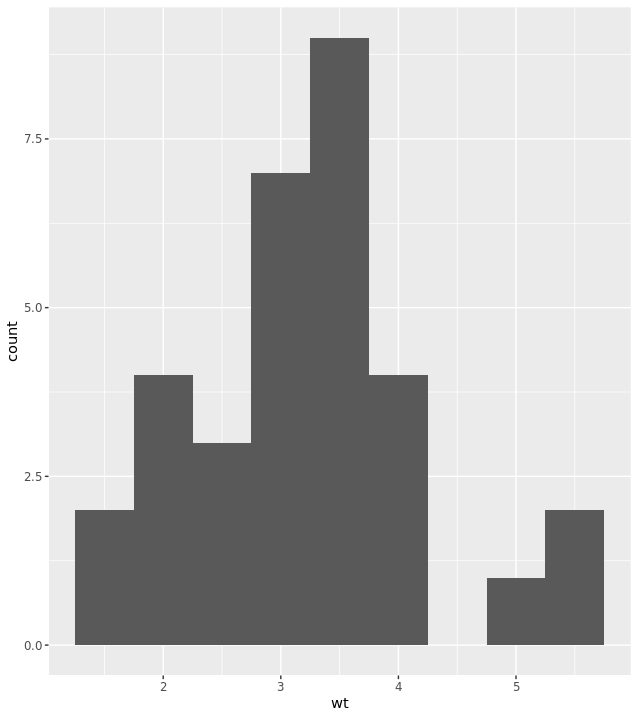
Finally, let us create the histogram of weight
wt.
最后,让我们创建重量wt的直方图。ggplot(aes(x=wt),data=mtcars) + geom_histogram(binwidth=0.5)
This concludes this lab, we hope that you had fun!
本次实验到此结束,希望您玩得开心!
Author(s) 作者
